
This blog post deals with happiness in today’s Western countries: How happy (measured in terms of overall “positivity”) are people in general?
KEYWORDS: core emotional energy, emotions, feelings, happiness, law of attraction, negativity-positivity spectrum, philosophy, positivity, psychology, sociology.

In this blog post I am going to talk a little bit about happiness: What are we looking at, in terms of “the big picture”, when it comes to people’s “core emotional energy”? In other words, how “negative” or how “positive” are people, in general, in the whole population?
Contents
Introduction
I will be limiting myself in my evaluation here to the Western world (North America and Europe), since those are the only countries that I have been living in, myself, for any length of time. So the following should be seen as an “informal” observation about the population, not as some kind of attempt of doing professional sociology, or social psychology.
My purpose here is simply to very roughly describe the current state of affairs: what is the “real” status of the population? If we know the answer to that question, then we can use it to our personal advantage in our everyday lives.
For, as I see it, one of the keys to living a good life is to be able to correctly assess any situation, and to take the necessary steps to change it, if necessary. So if one does not know the actual situation (whether it’s about oneself, or others), one may be much less motivated to do something about it.
This post may therefore assist those of you who want to make your lives better by mastering the art of using Law of Attraction.
The Core Emotional Energy Spectrum
I have previously talked about my Core Emotional Energy spectrum/scale and its different levels (N3, N2, N1, P1, P2, P3), meant to describe, roughly, people’s factual negativity-positivity status (which may be very different compared to what the individual himself or herself thinks).
In some posts I have introduced the concept of CEE, and in others I have started to identify certain emotional characteristics that people have, which “locate” or “place” them in a particular part of the spectrum.
What I am doing here today is that I am using many (as opposed to just one or two) characteristics to estimate the overall state of the population. Many of these characteristics are not yet presented in any of my posts or articles. But my ambition is that these will be discussed in (many) upcoming posts that I will gradually post during 2020.
Adults, Mid-Twenties
Let us start with people who are around 25 years of age. This is the time when many people have jobs and are settling down, on some level or other.
Previously, they may have been involved in extensive partying and such (especially if they are college or university graduates), or living at their parents’ place, etc. But now, in their mid-twenties, many (or most) are more “seriously” accepting certain responsibilities, in the form of getting jobs, taking bank loans, and engaging in “serious” relationships (whether married or not), etc.
The idea here is that they are now more “integrated” into society and its accompanying structures. They go to work, they pay tax, they may have a mortgage, they may feel a need to vote, the may listen to politics, economy news, etc. All of this influences their view of themselves in the world, and how “free” or “successful” or “happy” they feel.
And it is this “integration” into the world — not only regarding politics and economy, but also in terms of relationships and philosophical-spiritual issues — that determines their total (average) negativity-positivity “score” or “level”.
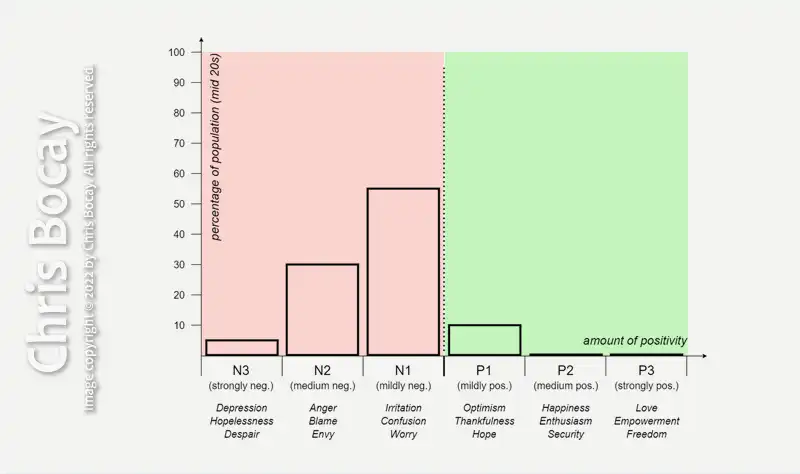
So even if some people very much think themselves to be very positive, the truth of the matter is, in my opinion, that most people in their mid-20s are not very positive people, as a whole (as I indicate in the diagram above).
My estimation is that most people (84%) are in the N1 category, with some 30% in the N2 category, and 5% in the N3 category. I have used a value of 10% in the P1 category, although this may certainly be too high of an estimate.
To say that people in general are mostly in the N1 and N2 categories is, however, not to say that they are negative about everything in their lives. No, I am not suggesting that. It may very well be that many persons have favorite hobbies or interests that make them very happy.
The problem, though, is that most people do not spend most of their time being happy, enjoying life, pursuing those things that they love the most. Instead they spend most of their time at work, doing something that they perhaps not always are so happy with, or surrounding themselves with people that they are not entirely happy with.
Adults, Mid-Forties
When people reach their mid-forties they usually get various “mid-life” problems. One such problem is that their main relationship may “fail”, making them more negative, as a whole.
This may, of course, be compensated for by either entering into another relationship with a new partner, or by getting some good promotion at work etc. But even if such compensation might very well occur, a more serious problem is simultaneously taking place.
I am here naturally talking about health. Although most people may not experience extreme conditions in their mid-forties, still various symptoms start appearing. These symptoms often indicate to the individual that his health is not what it used to be, and naturally also gives him or her various aches and pains and other concerns related to that (economical hardships, perhaps, related to various treatments: medical, dental, chiropractors, etc.)
This may also be a time for existential issues to pop up in one’s life. The issue about death, and God, and afterlife, etc. may, for some, be necessary to explore at this stage. In any case, the “effortlessness” of “normal life” is here gradually declining, and reasons for (continuous) complaints about life may be more and more frequent.

Because of the increasing amount of negativity, people are slowly transitioning to the left in the diagram. So in the N1 group we now have only 45% of the population here, compared to the mid-twenties distribution of 55%.
Most of them have populated the N2 group, where they now are 40% of the population. And the N3 group has grown to 10%.
Meanwhile, the P1 group has also decreased in size (to 5%), after some people now have “fallen down” to N1 instead. The P2 and P3 groups are steady, because these people are positive enough to combat the “big” problems in life, such as serious health issues, etc.
Adults, Mid-Sixties
When most people have reached their sixties, they experience substantial health problems, which may cause them various chronic diseases, or complicated treatments, with all the worries, pains, and financial issues it may cause.
Furthermore, it is now common to more “honestly” deal with fundamental existential questions. Who am I? What is going to happen after I die? Is there a heaven and hell? Etc.
All these things combined may be overwhelming. This may be very damaging to their emotional energy and the level of happiness. Many people acquire more negativity in this stage, complaining about their situation, and thus increasing their total negative emotional state (instead of trying to be hopeful, looking forward).

Thus, in the mid-sixties the trend remains, as in the mid-forties, that there is a migration of people to the left in the diagram. The number of people now is 35% in N1, 50% in N2, and 13% in N3.
Also, in the P1 group, 3% percent has transferred themselves to N1, or possibly N2, compared to in their mid-forties. The P2 and P3 groups, as before, are steady.
Children, Adolescents
Although I am not showing this with any diagram, children and adolescents are, I believe, on average happier than adults. Exactly how much is unclear. But I believe that the difference is not that great after, say, starting school.
But if we are talking about very small children, say a year old or so, then, I think, we must say that they are, on average, considerably happier than adults.
As I see it, the real change (in happiness) occurs in several phases. The first one is the general “domestication” or “taming” of the children that is done by parents, society, media, etc, to get them to “behave” and do what is “expected of them”. Suddenly there are lots of rules that weren’t there before, at an earlier age.
Another important phase is of course puberty and all that comes with it. For now there is the whole sexual thing and relationship thing to think about, and worry about. Am I attractive enough, etc.?
Conclusion
My tentative conclusion is simple: We get more and more negative as time goes by. There are many reasons for this: our health may decline, maybe our “dreams” didn’t manifest, and maybe the spouse left with a younger mate, etc.
In order to protect ourselves against such a shift into the negative, it is a wise idea, I think, to infuse oneself with as much positive thinking and practice as one can muster, as early as one can.
For only a person in the P2 group (medium positive) or P3 group (max positive) has enough positive energy to be able to overcome really fundamental problems such as serious health issues or financial hardships.
I also would like to say, here at the end, that the percentage values for the different groups (N3, N2, etc) are of course rough estimates. But I still think, with my own definitions of who an N1 is, or who a P1 is, etc., that my estimates are reasonably close to the actual situation.
One exception, though, is that I think I have overestimated the number of P1s in the mid-twenties and onward (I don’t really think they are 10%, but more like 5% or less in the mid-twenties). But I leave that for now, as “10%” may sound a little more optimistic (even though it may not be very realistic).
Chris Bocay


Leave a Reply